Online Course. Plain & Simple Lessons on Descriptive & Inferential Statistics Theory With Excel Examples for Business & Six Sigma
What you’ll learn?
- You will learn Descriptive and Inferential Statistics with the help of simple but practical examples.
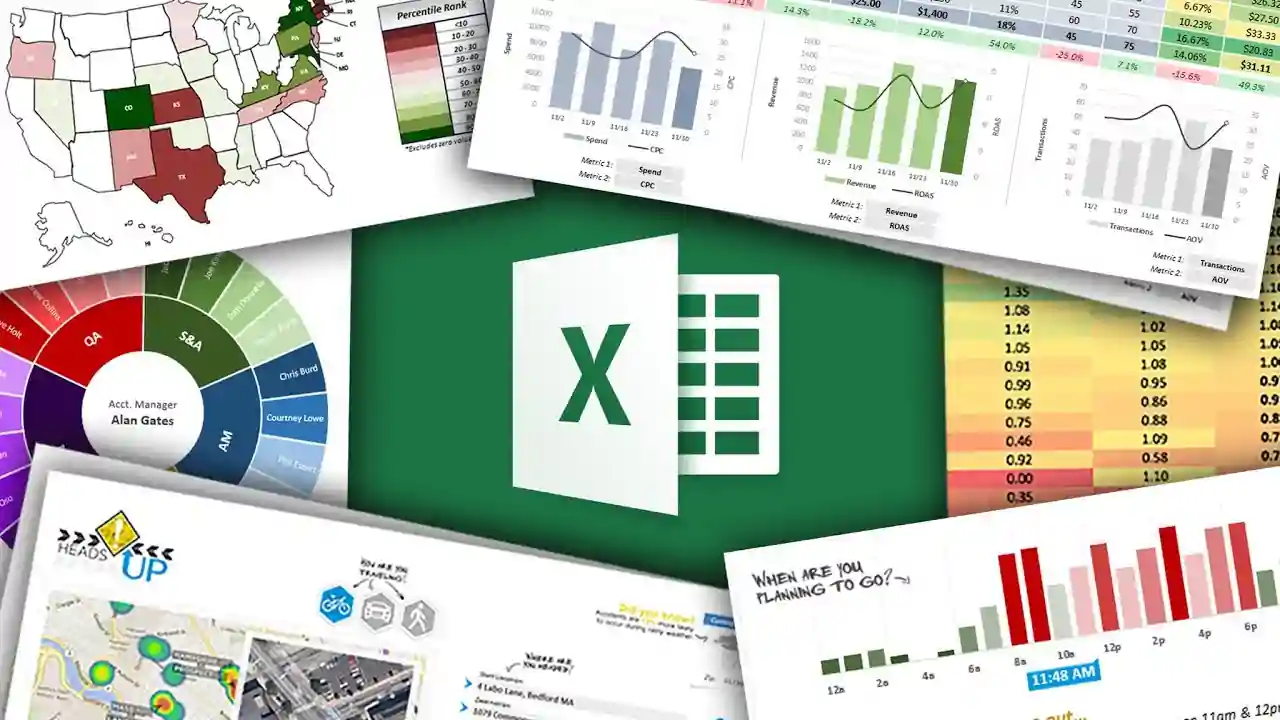
- You will learn to use the power of Microsoft Excel to perform statistical calculations for you. No need to remember long formulas and equations.
- You will understand statistics from basic to advance level to solve business problems using Microsoft Excel.
- You will learn to make sense out of vast amount of data around you, to make fact based decisions.
Requirements
- You should have some basic understanding of Microsoft Excel.
Description
Start loving data and making sense of it. Leverage the power of MS Excel to make it easy!
Learn statistics, and apply these concepts in your work place using Microsoft Excel.
This course is about Statistics and Data Analysis. The course will teach you the basic concepts related to Statistics and Data Analysis, and help you in applying these concept. Various examples and data-sets are used to explain the application.
I will explain the basic theory first, and then I will show you how to use Microsoft Excel to perform these calculations.
Following areas of statistics are covered:
Descriptive Statistics – Mean, Mode, Median, Quartile, Range, Inter Quartile Range, Standard Deviation
Data Visualization – 3 commonly used charts: Histogram, Box and Whisker Plot and Scatter Plot
Probability – Basic Concepts, Permutations, Combinations
Population and Sampling
Probability Distributions – Normal, Binomial and Poisson Distributions
Hypothesis Testing – One Sample and Two Samples – z Test, t Test, p Test, F Test, Chi Square Test
ANOVA – Perform Analysis of Variance (ANOVA) step by step doing manual calculation and by MS Excel.
Who this course is for:
- Business managers and data analysts who are trying make decision based on data and facts
- Six Sigma Green and Black Belt professionals using MS Excel to conduct statistical analysis
See more Statistics courses here