As a health economist, your role involves navigating complex datasets, extracting insights, and presenting findings that shape healthcare decisions.
But what if you could do all of this more efficiently, visually, and with greater clarity? Learning Tableau might just be the career catalyst you’ve been searching for. Here’s why:
The Power of Tableau for Health Economists
1️⃣ Transform Complex Data into Easy-to-Understand Insights
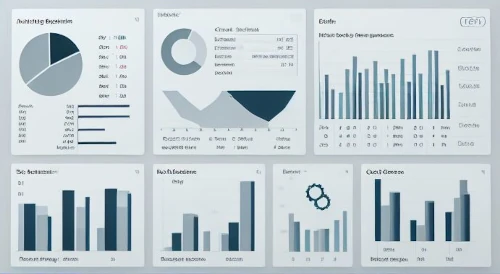
Health economics is all about evidence-based decision-making. With Tableau, you can translate dense cost-effectiveness models, QALY calculations, and epidemiological data into clear, interactive dashboards that stakeholders can easily comprehend.
- Imagine presenting your cost-effectiveness results to policymakers using a visual cost-effectiveness plane or CEAC curve, where they can interactively adjust thresholds and make concrete decisions in real-time.
2️⃣ Effortless Data Connection and Preparation
Tableau simplifies connecting to multiple data sources—Excel, CSVs, SQL databases, and even spatial data—allowing you to merge datasets seamlessly. This is especially important when working with real-world evidence (RWE) or combining data from clinical trials with cost datasets.
- Example Skill: In this Tableau course, you’ll learn how to connect Tableau to datasets and work with joins and blending, skills essential for creating a comprehensive view of health economic outcomes.
3️⃣ Make Abstract Analyses Concrete and Visual
Non-technical stakeholders (e.g., policymakers, healthcare executives) are more likely to engage with visuals than with spreadsheets. Tableau helps you create:
- Interactive dashboards to explore healthcare cost trends.
- Maps showing regional variations in treatment uptake.
- Time series charts to track budget impact over time.
With the skills taught in this course, you’ll learn how to design dashboards and add interactivity using filters, highlighting, and parameters—making your work actionable and accessible to a wider audience.
4️⃣ Save Time Through Automation
As a health economist, you don’t want to spend hours manually updating static reports. Tableau allows you to automate recurring data tasks, such as monthly healthcare cost updates, saving time and reducing errors.
- Course Highlight: Learn how to automate updates using data extracts and master advanced dashboard preparation techniques.
5️⃣ Better Understanding Leads to Better Decisions
When data is presented clearly and interactively, stakeholders are more likely to understand and act on it. Tableau equips you with the tools to present your findings in a way that fosters collaboration and accelerates decision-making.
- Visualizing cost-effectiveness data or health outcomes with Tableau allows decision-makers to confidently evaluate interventions and policies based on a clear understanding of the evidence.
Why Take the Tableau 2024 A-Z Course?
This Tableau 2024 A-Z: Hands-On Tableau Training for Data Science course offers a step-by-step guide to mastering Tableau, with practical applications that align perfectly with the needs of health economists.
What You’ll Learn:
- Core Skills: Create bar charts, scatterplots, and time series visualizations—essential for health economic analyses.
- Advanced Techniques: Work with dual-axis charts, table calculations, and parameters to develop sophisticated dashboards.
- Geospatial Analysis: Map data to understand regional variations in healthcare costs or treatment uptake.
- Interactive Dashboards: Build dashboards that allow stakeholders to adjust filters and parameters for real-time scenario analysis.
- Data Preparation: Fix data errors, work with joins and blends, and prepare datasets for advanced visualization.
Practical, Hands-On Learning
This course includes real-life exercises, challenges, and quizzes designed to make learning by doing a reality. As a health economist, you can apply these skills immediately to:
- Create visualizations for HTA submissions.
- Build dashboards for real-world evidence (RWE) projects.
- Develop tools to help stakeholders explore budget impact models interactively.
How Tableau Elevates Your Career
- Enhanced Communication Skills: Present your findings in a way that resonates with diverse stakeholders, turning complex analyses into clear, actionable insights.
- Time Efficiency: Automate repetitive tasks, leaving more time for strategic analysis.
- Career Growth: Differentiate yourself in job applications and build a reputation as a data-savvy health economist.
Take the Leap Today
Learning Tableau isn’t just about acquiring a technical skill—it’s about transforming how you deliver value as a health economist. This course, Tableau 2024 A-Z, gives you all the tools to level up your career and make your work more impactful.
Ready to become the go-to person for data visualization in your field? Enrol today and start building the skills that will future-proof your career. The healthcare sector is moving towards data-driven decision-making—don’t get left behind.
Enrol in the Tableau 2024 A-Z Course Now and take the first step toward becoming a health economist who stands out! Let your career soar with Tableau!
? See more Tableau Courses
